
 Edgar de Wit
Recently there is a lot of buzz about Power BI from Microsoft.
Power BI is a visualization tool, just like (for example) Tableau.
Microsoft has been working on Power BI since 2010. It originally started in Excel, with a function called Power Query. In short: it is Excel "Plus" for visualizing your data. But without the spreadsheets.
We are comparing Power BI with XLReporting in seven ways. What are the pros and cons? What is Power BI good at, and how does it compare to XLReporting?
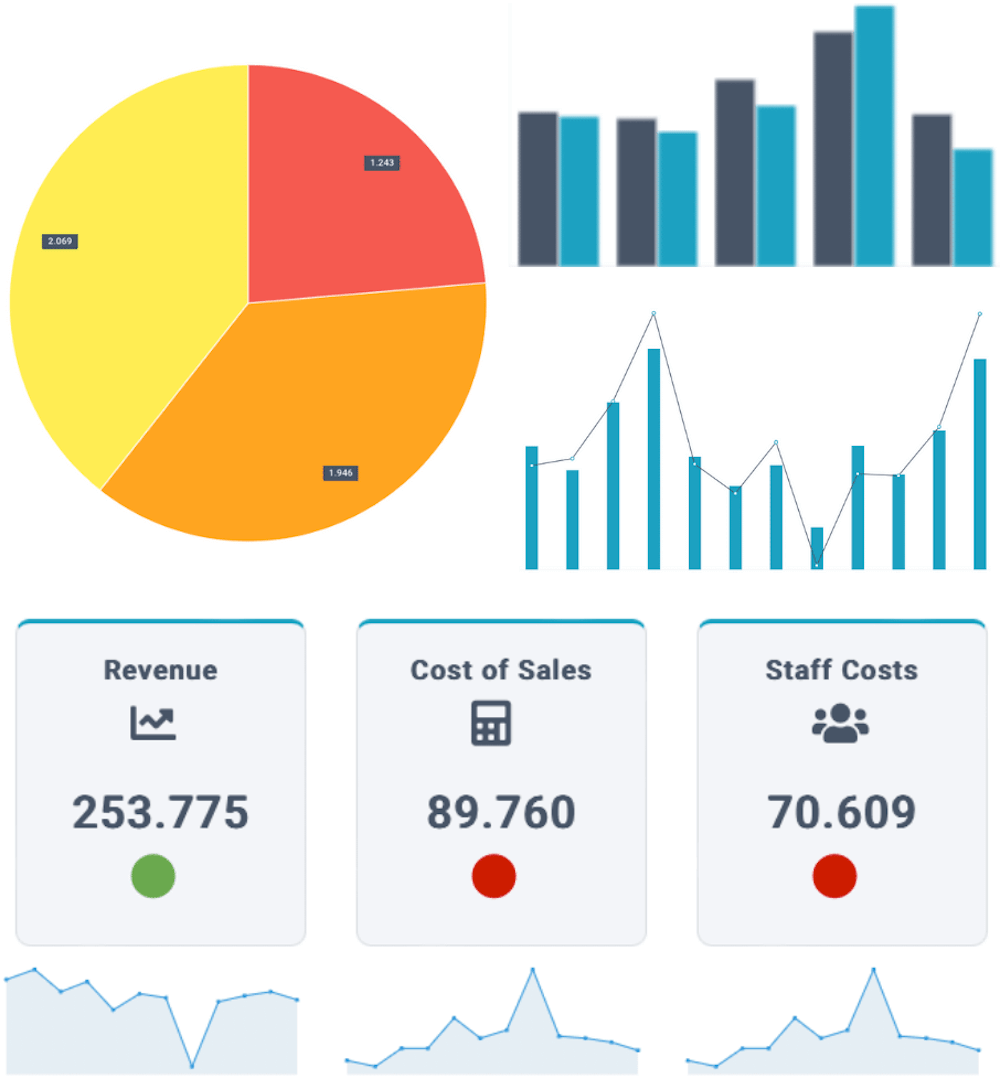
Power BI has a wide range of charts as a visualization tool. You will recognize most of the charts from Excel, such as bar, column, and line charts. But also geo-charts and pivot tables.
Just like XLReporting, the power of Power BI lies in the fact that you can automatically retrieve the data from source systems and visualize it. Excel isn't very good at that.
XLReporting offers the same chart types as Power BI. The big difference is in the customization options.
In Power BI you can adjust every single aspect of a chart. That opens up a lot of options and customizations, but also a lot of complexity.
XLReporting limits the number of options in visualization. In our experience, that is more than sufficient for almost every business, and it keeps things simple for our users. Our motto is "less is more".
As a result, the learning curve is low. After only a short training or watching our videos, users can create their own charts.
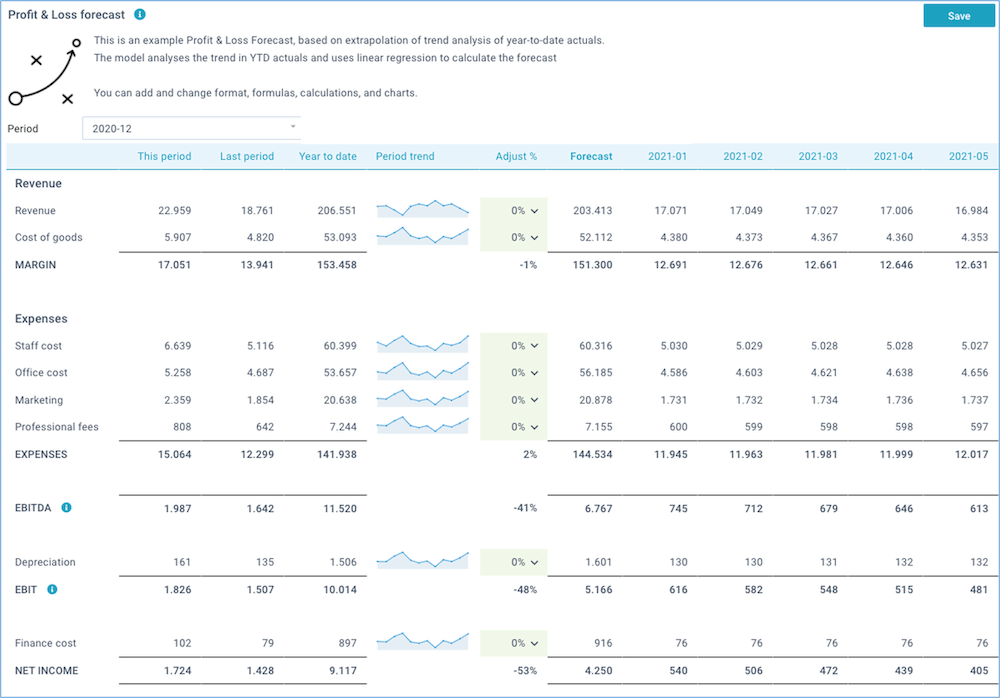
In Power BI you can not create custom formatted reports, such as annual statements or management reports. You will need other software to do that, or revert back to Excel.
In XLReporting you can create fully customised report models, using our spreadsheet editor. You can create any format, integrate data however you want (financial and non-financial), and make any calculations, in a familiar way.

Power BI can extract information from hundreds of sources. But it has limited options for interactive data-entry from users.
You may be able to create a simple input table. But that is not enough to create proper budget or forecasting submissions. If you want to plan or forecast, you will need other software.
In XLReporting, you can create your planning as easy as reports. Your planning data is immediately consolidated and visible in your reports and dashboards.
Creating dashboards is not the most complex part.
The complexity of Power BI lies in retrieving the data, bringing data together, and converting the values.
With Power BI you can connect with hundreds of sources. But you have to know how to do that. Unfortunately, this is not possible with just a few clicks.
You will also have to deal with a new kind of language, called Power Query M. With this special language, you can adjust the data in any way. But it's not easy to master.
Secondly, once you have collected the data, you need to create a data set for your dashboards. If you want to convert data to a proper format, and calculate, you need to use another language called DAX. DAX is a formula language used in Analysis Services, Power BI, and Excel Power Pivot.
It looks like Excel formulas, but it often does not work the same as in Excel. So you will have to learn 2 new languages and different syntax: Power Query and DAX.
Things are a lot easier in XLReporting. You can convert data and make calculations using formulas which are identical to Excel, with over 250+ compatible functions. Basic knowledge of Excel is enough to get started. And it works the same throughout the application, whether in imports, in reports, or in planning models.

Power BI is good for scaling, but it comes at a price. You can start Power BI with the free version, and create PBIX files. Think of it as an Excel document for Power BI. The file contains all the logic you defined to visualize with Power BI.
If you want to share dashboards with your colleagues, you could send them that file. But that is difficult to maintain and does not scale. If you really want to share data with your team, you would need to move to Power BI Pro.
Do you need more computing power? Or you want to share dashboards outside your organization, such as an accountancy firm with its clients? Then you need Power BI Premium.
In terms of scalability, XLReporting must be compared to Power BI Premium.
XLReporting has been developed for scalability. It doesn't matter if you work with 10 or 1,000 users, you won't have to do anything.
XLReporting is highly optimized and runs on our servers. If the servers need more capacity, it is automatically adjusted. You won't even notice, and this happens at no extra cost to you.
Microsoft itself does not have its own support for Power BI, but it does have a very extensive Knowledge base. If you can't figure it out, you can hire an external advisor or developer.
XLReporting has an extensive support center including tutorial videos. Our customers are supported by finance experts (not by automated bots or a help desk).
Pricing is another complexity of Power BI.
You need, at some point, a mix of Power BI Pro users, Power BI Premium users, and server capacity. Maybe Power BI Server too.
Suppose you have 20 users who are allowed to create dashboards and they share them with 50 users. With Microsoft Premium you will need the following:
XLReporting does not have pricing per user or server. You pay only for the number of reports and models that you create.
XLReporting starts at $500 a month for 20 reports, unlimited users, and data. For a complete reporting, consolidation, and budgeting platform.
You can find many user reviews of Power BI. With 2,400+ reviews at Gartner and 900+ at Capterra, you can read different experiences.
These are the most common positives and negatives of Power BI:
Power BI is one of the well-known names in Business Intelligence. You can start with a free version. But if you want to share and collaborate, the cost increases quickly.
And creating beautiful dashboards is one thing. But collecting, adjusting and preparing the data is the most important and difficult part. You will need knowledge, training, and special support to properly display your visualizations.
Do you want more than just dashboards and visualizations? Do you want to do budgeting and forecasting as well as consolidation and financial reporting? With a low learning curve at an affordable price, XLReporting is the right tool for you.
Contact us to request a demo or POC. We'll show you how XLReporting can add value to your company.
Back to the listSchedule a Meeting with one of our Planning and Reporting Experts.
Let's TalkXLReporting is an online Planning and Reporting Platform to create reports, budgets and forecasts the way you want.
![]()
![]()
![]()
![]()
© 2009-2025 XLReporting
® All rights reserved
