 Edgar de Wit
Finance software tends to make you choose.
You can have the flexibility of a spreadsheet, but then you spend your time maintaining files, formulas and versions. You can choose a more controlled financial system, but suddenly every new report or planning model becomes an IT project. Or you can build dashboards in a BI tool, only to discover that you still need Excel for budgeting and forecasting.
That is exactly the gap XLReporting was built to close.
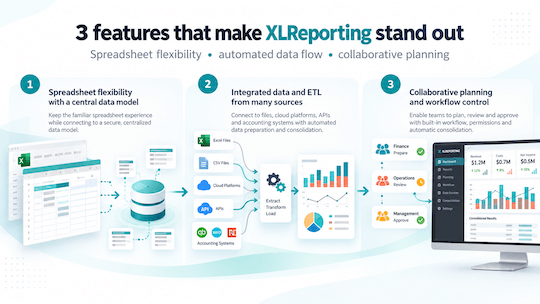
There are a lot of features in XLReporting. Reports, dashboards, forecasting, consolidation, cashflow planning, integrations, workflows, AI and much more. But if we had to pick three capabilities that really explain why the platform is different, these would be the ones.
Let's start with something finance professionals know very well: spreadsheets.
There is a reason Excel is still everywhere in finance. It is flexible. You can build almost anything, change a formula in seconds and create a model that follows the exact logic of your organisation.
The problem starts when the spreadsheet becomes the database as well.
Now your actuals, assumptions, formulas, mappings and reporting structure all live inside the same file. Someone copies it. Someone changes a formula. Another department has its own version. Then the numbers change and nobody is quite sure why.
XLReporting takes a different approach.
Its models have a familiar spreadsheet-style interface, with sheets, rows, columns, cells, formatting and Excel-compatible formulas. XLReporting supports more than 300 functions, including more than 100 functions specifically designed for the platform. But the important difference is underneath: the model contains the logic and layout, while the data remains centrally stored and is retrieved when the model runs.
That distinction sounds technical, but it solves a very practical finance problem.
Imagine your personnel forecast uses actual headcount, salary information and assumptions about future hires. In a traditional spreadsheet, you might copy all of that data into several worksheets and build formulas around it. Next month, you repeat part of the process.
In XLReporting, the model can retrieve the underlying data dynamically. Change the period, company or cost centre, and the model can use the relevant information without creating another workbook.
You keep the flexibility to build the calculation you need, but you no longer have to treat a spreadsheet file as your financial database.
And that makes the model much easier to maintain.
It also means finance teams are not restricted to predefined templates. You can create your own datasets, models and reports, use Excel-compatible formulas for complex calculations and change the configuration as your organisation changes.
Before you can report, forecast or consolidate anything, you need the data.
And that is where an enormous amount of finance time disappears:
The final dashboard may look impressive, but there can still be a very manual process underneath it.
XLReporting approaches this as a complete data flow rather than only a reporting problem.
The platform supports more than 40 integrations, including accounting systems such as Exact Online, Twinfield, QuickBooks and Xero. Data can also come from Excel, CSV, XML and JSON files, cloud storage, databases and APIs. Financial and non-financial information can be brought together in the same environment.
More importantly, the import process can do more than simply copy data.
XLReporting supports ETL processes: extracting the source information, transforming it and loading the result into a structured dataset. During that process, data can be mapped, filtered, validated, calculated and consolidated. Imports can also be grouped into automated batches.
Consider a company with five entities. Each company has its own administration and perhaps a slightly different chart of accounts. Management wants one consolidated P&L, EBITDA by business unit and a comparison against budget.
You could solve the reporting part with a dashboard. But someone still has to make those five administrations comparable first. That is the real work.
With XLReporting, those mappings and transformations become part of the repeatable process. Once the data has been imported and structured, the same information can feed reports, dashboards, forecasts and planning models.
And reports always run against the latest available data rather than a copy sitting in somebody's workbook.
Budgeting creates an interesting contradiction.
Finance wants input from the organisation, because managers know what is happening in their departments. But the more people become involved, the harder the process can be to control.
So what happens?
This is one of those processes that works surprisingly well, until the organisation grows.
XLReporting turns that spreadsheet exchange into a controlled workflow.
Planning models can contain designated cells where users enter or edit information and save it directly into the database. Budget holders can therefore contribute their own figures without receiving their own copy of the complete financial model.
Role-based access goes a step further:
XLReporting also supports review and approval workflows, multiple budget versions and automatic consolidation of submitted budgets. User actions are recorded, providing a much clearer audit trail than circulating spreadsheet files.
This changes the role of finance in the budgeting process. Instead of collecting files, checking versions and repairing templates, finance can manage the assumptions, structure and process. The organisation provides the input. The platform controls the workflow. And finance remains in control of the model.
Individually, none of these problems are new.
Finance teams have been building models in spreadsheets for decades. Integration tools can move data. Budgeting applications can collect departmental input. BI platforms can create dashboards.
The difficulty is what happens when you have to connect all of them. That is where the combination inside XLReporting becomes interesting:
For many finance teams, that is the difference between automating a report and actually improving the financial process behind it.
Back to the listSchedule a Meeting with one of our Planning and Reporting Experts.
Let's TalkXLReporting is an online Planning and Reporting Platform to create reports, budgets and forecasts the way you want.


© 2009-2026 XLReporting
® All rights reserved
