When You Outgrow Excel, Financial Reporting Becomes Infrastructure

Outgrow Excel: Financial Reporting Becomes Infrastructure

author Edgar de Wit


Nobody wakes up one morning and decides: “We have outgrown Excel“.

It happens much more quietly:

  • A company adds a second entity.
  • Management wants reporting by department.
  • A board asks for consolidated numbers.
  • Someone introduces Power BI.
  • Budget holders need access to forecasts.
  • A consultant builds a clever workaround.
  • Another consultant builds an even cleverer one.

But before you know it, what started as a spreadsheet has become an entire financial reporting process.

That is the point where the conversation about Excel usually goes wrong. The problem is not that Excel suddenly stopped working. The problem is that the organisation changed.

Excel is a tool. Reporting becomes infrastructure.

There is an important difference between creating a financial report and running a financial reporting process.

Creating a report can be simple: Get the trial balance. Add some formulas. Create a P&L. Add a few charts. Done.

  • But then people start depending on it.
  • The CEO wants it every month.
  • Department managers want their own numbers.
  • Investors want another format.
  • The accountant needs different classifications.
  • A second company uses a different chart of accounts.
  • The budget needs to be compared with actuals.
  • And Finance needs to explain where a number came from six months later.

At that point, you are no longer maintaining a spreadsheet. You are maintaining infrastructure. And infrastructure has different requirements:

  • It needs to be repeatable.
  • It needs to be understandable by more than one person.
  • It needs to survive organisational changes.
  • And it needs to produce the same answer regardless of who happens to be working on it.

That is usually where Excel starts showing its limits. Not because the formulas are wrong. Because the operating model around them no longer scales.

The first warning sign is usually not an error

It is maintenance. This is something consultants recognise immediately.

A financial model can be perfectly correct and still be a bad solution.

Why? Because every new client, entity, department or reporting requirement adds another piece that somebody needs to maintain.

A consultant creates a management reporting workbook for a client. It works fine. Until it doesn't:

  • The client changes its chart of accounts.
  • So the workbook needs an update.
  • A new company is acquired.
  • Another mapping is added.
  • Management wants EBITDA reported differently.
  • The cost centre structure changes.
  • The report needs to work for twelve other clients.

Individually, none of these requests is particularly difficult. Together, they create a maintenance business. And that is a very different business from advisory.

The consultant trap: expertise that cannot scale

Good consultants create value by understanding a client's business:

  • They know which KPIs matter.
  • They understand the chart of accounts.
  • They know how management wants to see performance.
  • They can translate messy accounting information into something useful.

The problem starts when all that expertise is embedded in individual Excel files. Because knowledge inside a workbook is difficult to reuse:

  • A formula belongs to that file.
  • A mapping belongs to that client.
  • A change has to be repeated.
  • A new colleague first needs to understand how the model works.
  • And the person who built it gradually becomes the person everyone calls when something breaks.

This creates an interesting paradox. The better the consultant becomes at creating custom reporting solutions, the harder it can become to scale the service. You keep winning clients. But every client adds maintenance.

At some point, growth creates more work almost one-for-one. That is not really scalability.It is linear expansion disguised as growth.

Consolidation tends to expose the problem first

Single-company reporting can hide spreadsheet complexity for quite a long time. Consolidation is less forgiving:

  • Now you are dealing with multiple entities.
  • Different charts of accounts.
  • Different accounting systems.
  • Intercompany positions.
  • Eliminations.
  • Currencies.
  • Ownership structures.
  • Local adjustments.
  • Group reporting.

Suddenly the question is no longer: “Can we build this in Excel?” Of course you can. Finance professionals have built remarkably sophisticated consolidation models in Excel.

The more useful question is: “What needs to happen every month to make this model produce the right answer?”

That question changes the discussion.

If the answer involves exporting data from several accounting systems, updating mapping tables, checking formulas, copying adjustments, reconciling balances and asking one particular colleague why company 7 does not balance.

You may not have a reporting problem. You have an architecture problem.

Then somebody suggests Business Intelligence

At first that makes sense. Business Intelligence can solve an important part of the problem:

  • Instead of distributing static spreadsheets, data can be visualised in interactive dashboards.
  • Management gets charts.
  • KPIs become easier to explore.
  • Users can drill into information.
  • And suddenly financial reporting looks much more modern.

But a dashboard does not automatically fix the process underneath it.

If budget data still comes from Excel, consolidation still happens elsewhere, mappings are maintained manually and forecasts live in separate files, you may simply have added a better-looking front end to the same fragmented process.

The dashboard is not the problem. The architecture underneath it is.

This is why the discussion should not be Excel versus Power BI versus another reporting tool. They each serve a different purpose.

The real question is:

  • Where does your financial logic live?
  • Where are accounts mapped?
  • Where are adjustments made?
  • Where is budget data stored?
  • Where does consolidation happen?
  • Who controls the definitions?
  • How many manual steps are required before management sees the result?

Those questions tell you much more about the maturity of financial reporting than the dashboard on the screen.

The hidden costs of spreadsheets

There is a cost to all of this that rarely appears in the P&L. Call it the hidden costs of spreadsheets.

It is the time spent:

  • Finding the latest version.
  • Checking whether formulas still work.
  • Explaining somebody else's model.
  • Updating mappings.
  • Copying data between systems.
  • Rebuilding a report after a reorganisation.
  • Reconciling numbers that should already agree.
  • Making the same change across twenty client environments.
  • Waiting for the one person who understands the model.

None of these tasks on their own are dramatic. That is precisely why they survive for so long:

  • Ten minutes here.
  • Half an hour there.
  • A few hours at month-end.
  • An extra day during budgeting.
  • Another review before the board meeting.

But it all adds up. Eventually, highly qualified finance professionals spend a remarkable amount of time keeping the reporting machine running.

And because the machine still produces reports, the underlying cost remains largely invisible.

Growth changes the economics

This is why small organisations can operate extremely well with Excel. They should.

If one finance manager creates a monthly report for one company using one accounting system, implementing an elaborate reporting platform may solve a problem that does not exist.

But scale changes the equation:

  • Five entities are not simply five times one entity.
  • Twenty budget holders are not simply twenty people entering numbers.
  • Fifty clients are not simply fifty copies of the same report.

Every additional dimension creates interactions:

  • More mappings.
  • More permissions.
  • More exceptions.
  • More versions.
  • More dependencies.
  • More questions.
  • And more maintenance.

At some point, the cost of flexibility becomes larger than the benefit.

That is what outgrowing Excel actually means.

When changes become too expensive

Imagine management asks for a change today:

  • A new entity needs to be added.
  • A department has been reorganised.
  • The board wants another KPI.
  • A new accounting system needs to be connected.
  • The forecast needs an additional scenario.
  • A consultant wants to roll out an improved report across forty clients.

How much work does that change create?

If one logical change requires ten manual changes elsewhere, the problem is not the change. It is the structure.

A scalable financial reporting environment should allow Finance to define logic once and reuse it.

  • Data should come from controlled sources.
  • Mappings should not be hidden inside individual workbooks.
  • Reports should use shared definitions.
  • Actuals, budgets and forecasts should be able to meet in the same reporting structure.

Simply adding another company, user or client should not require rebuilding the process from scratch.

This is where XLReporting fits

XLReporting is not based on the idea that finance professionals should stop thinking like spreadsheet users. Quite the opposite: Rows, columns, formulas and financial models are incredibly effective ways to express business logic.

The important distinction is where that logic and data are managed.

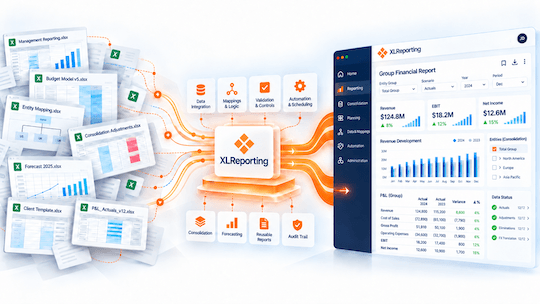
XLReporting combines a spreadsheet-like modelling environment with centrally managed data, reporting, forecasting and consolidation.

That means a finance team can keep much of the flexibility it values without turning every recurring process into another workbook.

  • Accounting data can be imported and mapped centrally.
  • Multiple entities can use a common reporting structure.
  • Actuals can be combined with budgets and forecasts.
  • Reports and dashboards can use the same underlying information.
  • And changes to shared logic can be managed as part of the reporting environment rather than copied from file to file.

For consultants and accounting firms, that distinction becomes even more important.

If reporting logic can be standardised while client-specific differences remain configurable, expertise becomes reusable:

  • You stop building fifty-odd similar (but not identical) solutions.
  • You start managing one solution for fifty clients.
  • That is a very different model.

The goal is not to eliminate Excel

There will always be a spreadsheet. And there should be.

Sometimes you need to investigate something quickly:

  • Build an ad-hoc calculation.
  • Test an assumption.
  • Analyse an unusual transaction.
  • Or simply think.

Excel is excellent for that. But there is a difference between using Excel and depending on Excel.

Using Excel gives finance professionals flexibility.

But depending on Excel turns individual files into critical infrastructure. And critical infrastructure deserves a little more structure.

So, have you outgrown Excel?

Do not count spreadsheets. Do not count formulas. And do not ask whether your current model still works.

Ask something else: what happens when the organisation changes?

  • Can you add another entity without redesigning the reporting process?
  • Can another colleague understand and maintain the logic?
  • Can you trace a management number back to its source?
  • Can your budget and forecast use the same structure as your actuals?
  • Can a reporting improvement be rolled out once instead of repeated manually?
  • Can consultants spend more time advising clients than maintaining their files?

If the answers are becoming uncomfortable, Excel probably did not fail you. It did exactly what you asked it to do.

Your organisation simply grew into something bigger.

And your financial reporting needs to grow with it.

Back to the list


Recent blogs:

When You Outgrow Excel, Financial Reporting Becomes Infrastructure
XLReporting features that make a real difference for finance teams
What is new in release 41
Capacity and staffing models
How to deal with seasonality and unpredictable demand

Popular blogs:

A Guide to Consolidation with QuickBooks
A step-by-step Guide to Financial Consolidation
Build the Right Budget Structure for your Business
Report on Xero Tracking Categories
Build effective Budget Models

More about Reporting:

When You Outgrow Excel, Financial Reporting Becomes Infrastructure
XLReporting features that make a real difference for finance teams
Capacity and staffing models
How to deal with seasonality and unpredictable demand
Production drivers for manufacturing

More from Edgar de Wit:

When You Outgrow Excel, Financial Reporting Becomes Infrastructure
XLReporting features that make a real difference for finance teams
What is new in release 41
Capacity and staffing models
How to deal with seasonality and unpredictable demand

Back to the list

Start Your Solution Today

Schedule a Meeting with one of our Planning and Reporting Experts.

Let's Talk

We value your privacy

We use cookies to enhance your browsing experience and analyze our traffic.
By accepting, you consent to our use of cookies.

Accept Reject Cookie Policy