How to use the Expense Analysis
The Expense Analysis the ultimate report for understanding your business's spending and cost performance. It provides a deeper analysis of your expenses by company, department, and product, and helps you identify trends, understand cost phasing and make informed decisions.
The report allows you to analyze the cost phasing of your expenses, understand when and where your expenses occur and make decisions accordingly. It also allows you to drill down and see the trends and patterns in your expenses. You can see the performance of different products, departments, and companies, and understand where your expenses are coming from.
Below is a step-by-step guide on how to use the Expense Analysis. For more detailed instructions, click here.
1. How to Start
You will find the Expense Analysis report in Essentials -> Report.
Click on the field behind the Run button, and select the desired financial period from the dropdown menu.
Click on the Run button to retrieve the latest version of your Expense Analysis report.
2. Choose a layout
The report gives you a snapshot of how your business is doing as per the end of the financial period you selected, compared to your budget. The Expense Analysis report offers many different ways (we call them Layouts) to view your numbers. You can freely switch between all layouts, and even personalize them.

3. Filter the data
You can make the report show only the information that matters to you. For example, you can filter the report to show just one department, one company, or one financial period. To filter the report, use the filters on the top of every layout. To show all data, simply leave the filters empty.

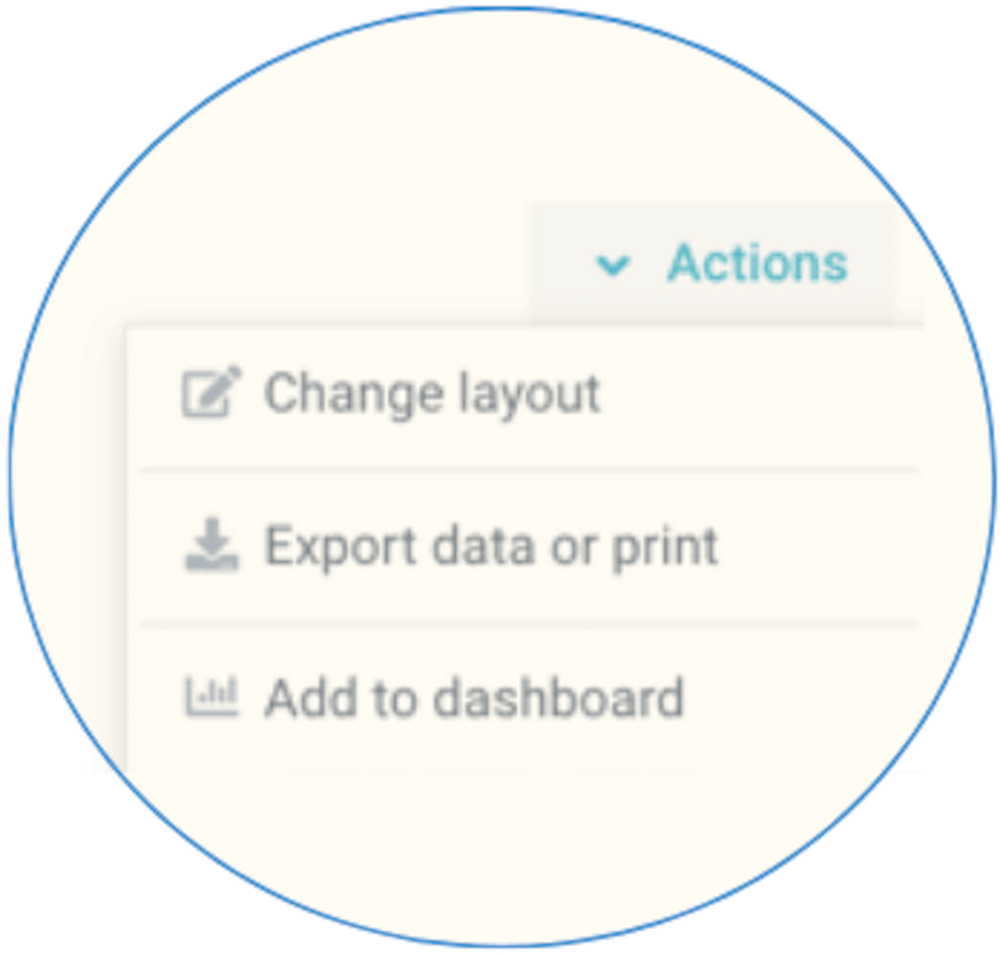
4. Choose from Actions
When running a report, you can click the Actions button in the right-top of the screen to open a dropdown menu with further options:
- Change layout
- Export to Excel or PDF file
- Print the report
- Add to dashboard
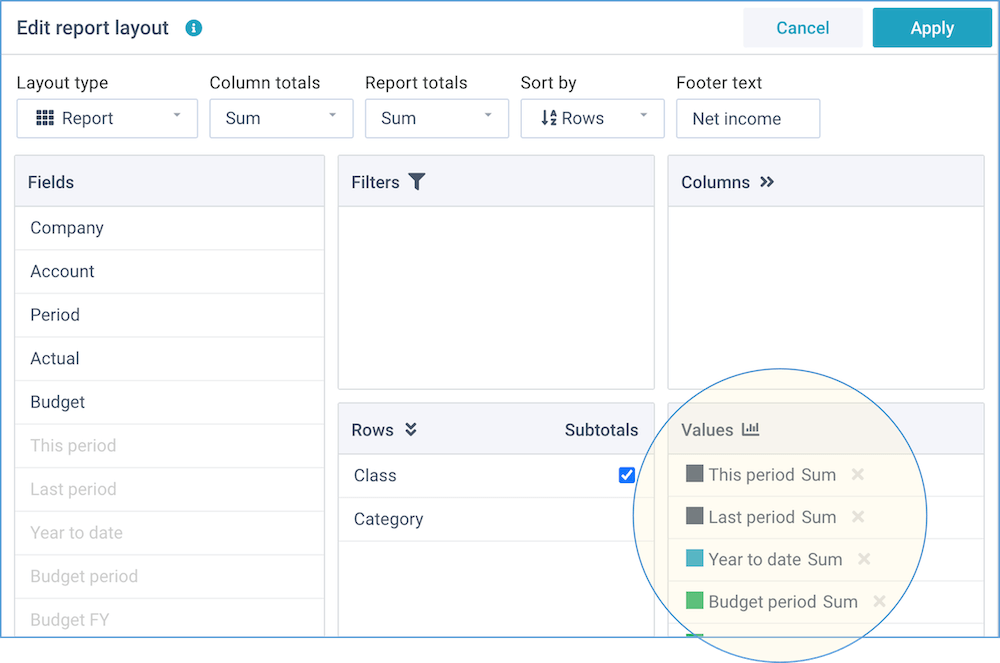
5. Change the layout
To change the layout, click the Actions button in the top right corner of the screen, and then select Change layout. You will see a list of all available fields in the report, which you can drag and drop into the desired section in the report. For more detailed instructions on changing a report layout, click here.
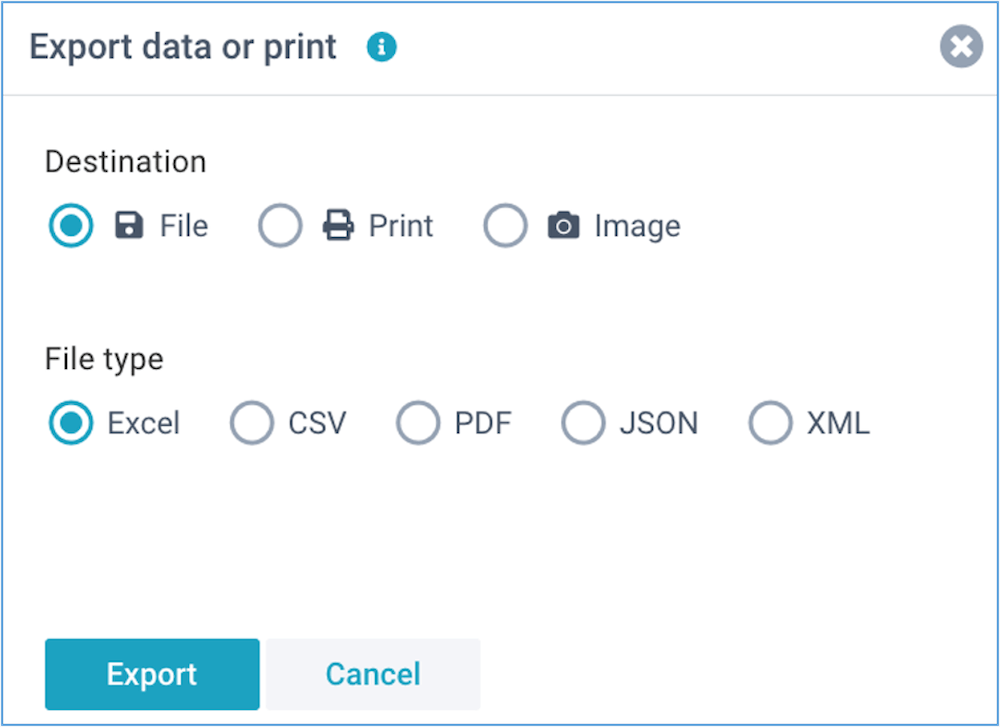
6. Export to Excel or PDF
To export the current layout to Excel, or to a PDF file, or to print it, click the Actions button in the top right corner of the screen, and then select Export data or print.
You can export the report to a large variety of file formats, Excel and PDF being the most often used.
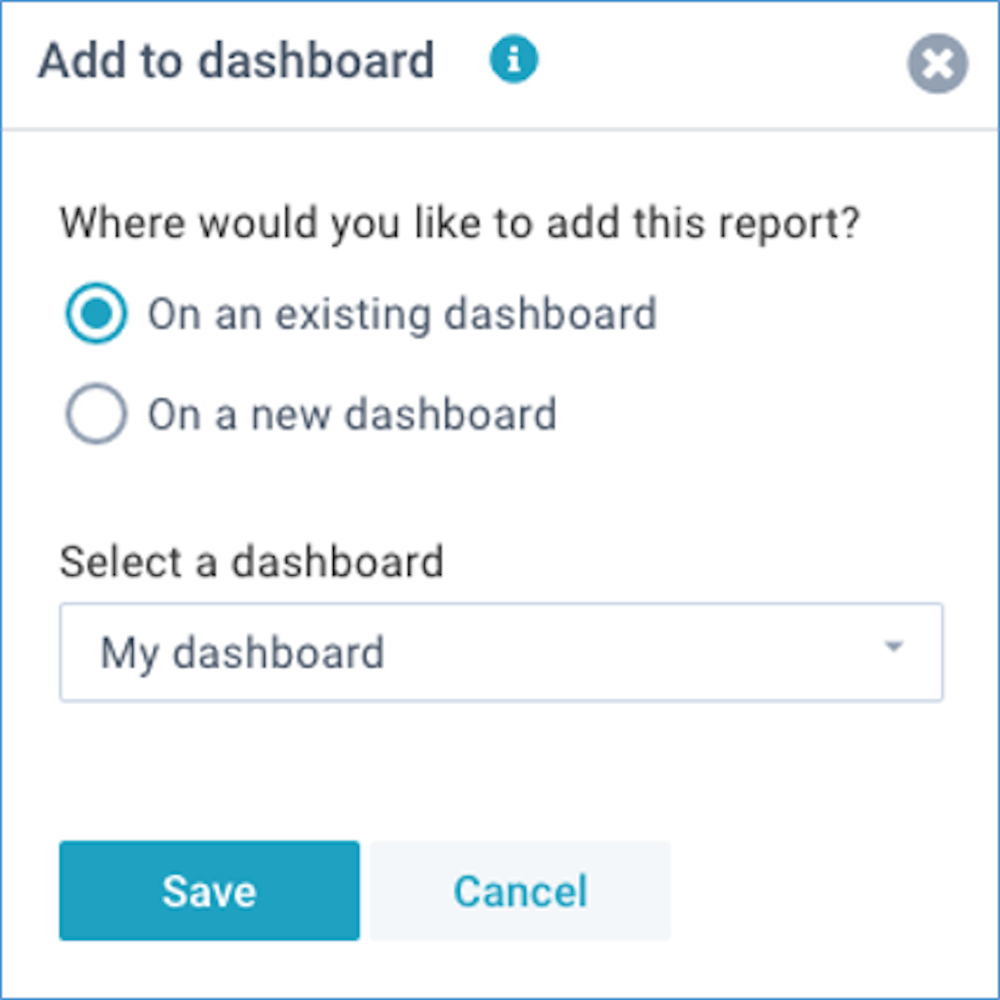
7. Add to dashboard
To add the current layout to your personal dashboard, click the Actions button in the top right corner of the screen, and then select Add to dashboard.
You can add the report to an existing dashboard, or create a new dashboard.
By following these simple steps, you can easily use the Expense Analysis report to understand your business's expenditure and make informed decisions.
If you like to read more detailed instructions, click here.