Types | Create | Settings | Sheets | Toolbar | Editing | Queries | Report queries | Functions | Cell objects | Planning models | Cell editors | Editor cell formats | Planners | Popup tables | Images | Charts | Tables | Row actions | Import queries | Batch | Actions | Import | Print/PDF | Review | Dashboard
Define models
Models are configurable objects that combine data queries with spreadsheet-like templates, enabling you to build advanced reporting and interactive planning models. You can give each model a name, define the template, create formulas and logic, add queries, and set user permissions.
Once created, you can run models as often as you want. XLReporting will always pull the latest data into your templates.
You can also watch the tutorial video.
When you sign up, your tenant already has a number of predefined models, aimed at financial reporting. They contain example data of a fictitious company. You don't have to start from scratch, you have working examples which you can start with, and you can add or change models at any point in time.
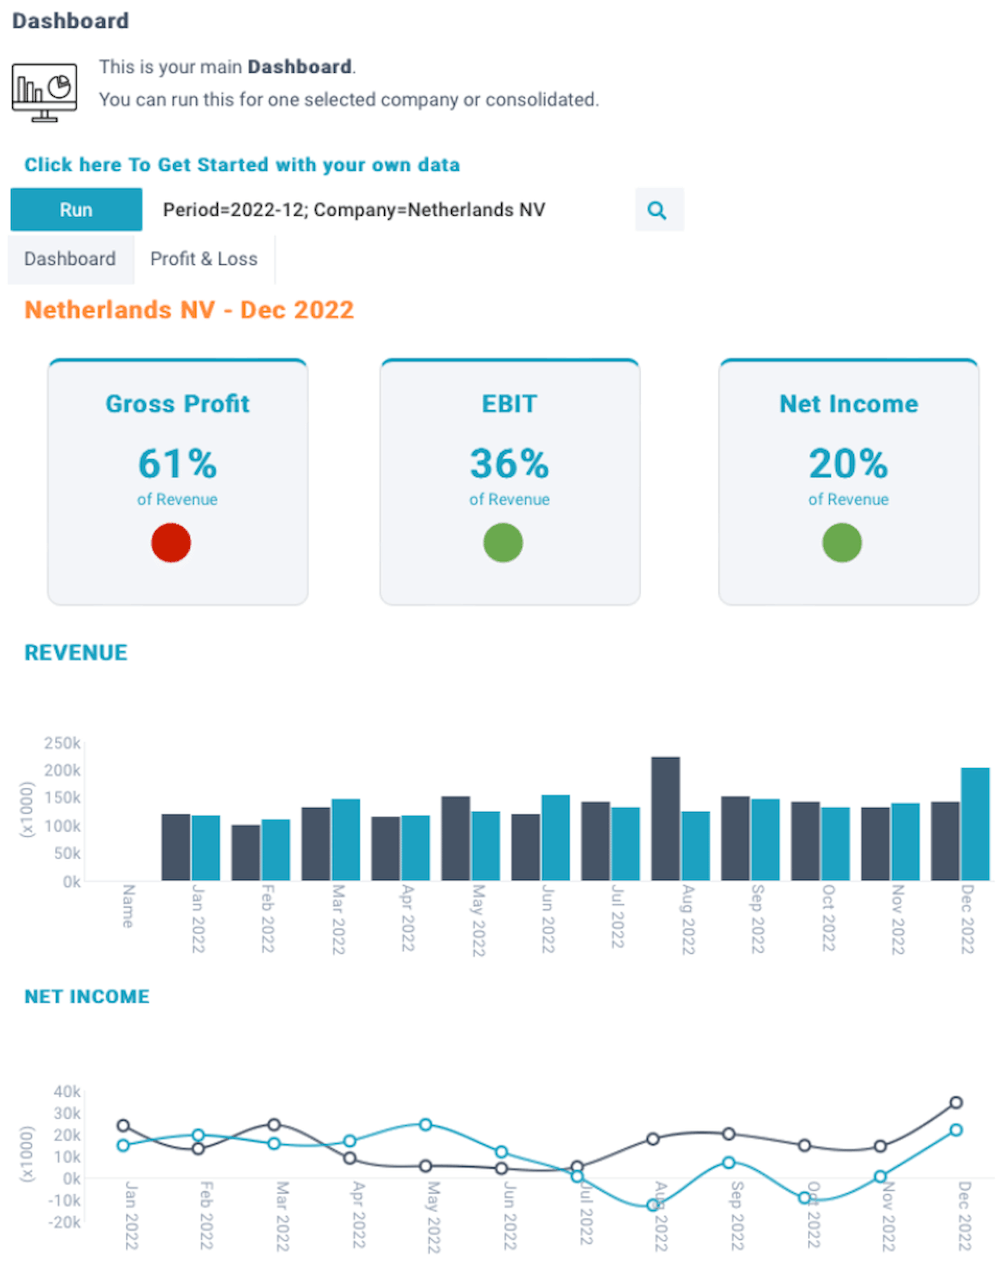
Some common examples of models are:
- Management dashboard
- Annual budget form
- Monthly reforecasting form
- Sales planning form
Unlike spreadsheets, XLReporting models enforce proper separation between logic and data. When creating models, you should not enter data into a model, but use queries instead.
Types of models
Models are typically used for 2 different purposes:
- Reporting - build your own custom reports. You can combine very diverse types of data into one model, apply your own format, add formulas, functions, and calculations, and integrate charts, icons, links, and images in your model (watch the tutorial video).
- Planning - build interactive planning models. You can pull data into your model, define cell editors, and allow users to enter data into the model in designated cells. You can apply formulas, functions, range filters, and calculations, and save the results back into data sets (watch the tutorial video).
Create a model
You can create a model in two ways (watch the tutorial video):
- Click on Define - New in the sidebar menu, or click the New button in the top of the screen.
- Click on the Actions - Create new button of an existing model. This also enables you to make a copy of an existing model.
Either way, the rest of the process is the same, and you can enter a name for your new model, set user permissions for it, and define its sheets and queries:

When you create a model, you should focus on the template, don't enter real data. You can integrate data through queries, which we'll explain below. The above example -with just a few rows- is a fully functional model.
You can use the toolbar to populate and format the cells, create formulas, set named ranges and conditional formatting - all in the same way as in Excel. You can also insert objects, such as cell editors, named ranges, sparklines, images, web links etc. XLReporting supports all common spreadsheet functionality. You can create multiple sheets if needed.
Settings
You can define the settings for the model via these fields:
- Name - enter a name. This must be unique within all your models.
- Group - select how this model is to be shown in the menu navigation.
- Active/locked - activate or lock a model. When locked, this model is not visible in the menu, and the model can not be used.
- User roles - select one or multiple user role(s) to restrict access to this model. If you leave this blank, all users have access.
- Import batch - combine other imports into a batch together with the import queries of this model.
- Multi/Single - select whether this model can be run (with the same selections) by multiple users at the same time, or only by one single user. The default is multi-user. Single-user mode can be relevant for data-entry models, to prevent users from overwriting each other's edits. If a user runs a single-user model that is already opened by another user (with the same selections), a message will indicate that, and the model will be opened as read-only.
- Sort - define an (optional) sort order (1-9999) that determines where this model is displayed in the menu. If you leave this blank, the model is ordered alphabetically.
- Description - enter an (optional) description to explain the use of this model to users. The text can contain basic html tags to format your text (e.g. <br> for a next line, <b> for bold text). The text can also contain functions to include dynamic information or images in the text.
- Script - create a script to process query data before it is being inserted into the model. This option is for advanced use, and only visible if your user role has the relevant permissions. Read more about scripts.
Sheets
Models can contain multiple sheets. Each sheet can contain its own content and layout. You can add sheets by clicking on the + icon. You can rename or delete a sheet by clicking on the arrow behind the sheet name. You can also re-arrange the order of sheets by simply dragging them.
If you prefix a sheet name with an underscore (e.g. _test), that sheet will be hidden in Run models. This is useful for sheets that are used for calculations or data processing but which you don't want to show to the user when running the model.
Toolbar
XLReporting has a powerful built-in spreadsheet, fully compatible with Microsoft Excel, in which you can build your models. You will find familiar tasks, such as sheets, columns, rows, cells, styling, functions, and a toolbar. You can create models in the same way you would build spreadsheets, with one major difference: models only contain logic and layout, they do not contain data. The data is retrieved in realtime through queries and functions.
Read more about working with the toolbar and the spreadsheet.

Editing
Models are very flexible, and you can adjust their structure as needed, similar to a spreadsheet. XLReporting supports all types of editing operations that you probably are already used to, such as:
- Insert and delete columns and rows, change their widths, heights, hide or show them etc
- Apply a large set of cell formats, such as number formats, fonts, colors, cell wrap, merge, align etc
- Apply conditional cell formats (different colors based on cell values)
- Cut, copy, and paste data from one cell (range) to another. Paste Special enables you to paste only specific elements such as values, formulas, styles etc
- Create your own formulas, with any calculations you want, assisted by a library of 300+ functions
- Define named cell ranges
- Insert cell editors with validation rules, and row actions, to create powerful data entry models
- Insert charts, icons, images, hyperlinks, comments etc
- Set dynamic filters in columns
- Display frozen rows or columns, rulers etc
- Undo reverses the last action, while Redo reapplies an action that was undone
Queries
Queries enable you to define how data sets will be integrated into your model. A model can contain multiple queries. During Run model, all its queries are simultaneously executed against the XLReporting database and the resulting realtime data is inserted into the model.
You can define queries by clicking on the Define button:

This opens a dropdown menu with further options:
- Add a new query - create a new query.
- Edit this query - edit the definition of the currently selected query.
- Delete this query - delete the currently selected query.
- Hide the preview - hide the preview with query results.
When you add a new query, or edit an existing query, the first step is to choose the type of query and determine the name and settings for that query:

You can choose between 3 types of queries:
- Report - read data from your data sets, and insert the entire formatted report into a designated cell range in your model.
- Data list - read data from your data sets into memory, which enables you to use cell functions to insert data into individual cells in your model.
- Import - read cell ranges in your model and import the information into your data sets.
If you select Report or Data list, you need to select the source data set: this is the primary data set that you want to retrieve information from. All its linked data sets will be automatically included, and you can create a report in exactly the same manner as Define reports, including converting the data, filtering the data, and setting the report options and fields position.
If you select Import, you need to select the target data set: this is the data set into which you want to import the data from your model. You can create the column mapping in the exactly the same manner as Define imports, including mapping the columns, converting the data, filtering the data, and the settings for inserting or replacing data.
In Options when running the model you can select a number of features:
- Insert data rows - should the data be placed in dynamically inserted rows, or should the data overwrite the existing rows? This choice depends on the design of your model.
- Insert data columns - should the data be placed in dynamically inserted columns, or should the data overwrite the existing columns? This choice depends on the design of your model.
- Repeat grouped values - this is useful if you want to show values for every column and row (as opposed to the normal report mode which leaves grouped row fields blank, rather than repeat them).
- Subtotalise adjacent columns - this is useful if you want subtotals to be automatically applied to columns adjacent to the query range. The subtotals will be applied based on the grouping of the rows fields in the query. Please note this function requires that the layout of the report query has at least one rows field and at least one value field.
- Show the query description - choose whether the query description will be shown when running the model.
Once you completed the query definition, a special function will be inserted into the current cell: =QUERY(ID, range), where ID is the query number, and range is the cell range into which the query data will be inserted. The function shows the description of the query.
After every change, the preview of the query results is automatically refreshed, which helps to integrate the query into your model.
Report queries
The cell that contains the =QUERY(ID, range) function indicates where the query data will be dynamically inserted during Run model:

The 3 rows below the placeholder are templates for the actual query data:
- Headers - the query column headers will be placed on this row.
- Data rows - the query rows with data. Dependent on the
options that you selected:
- the data will be placed into dynamically inserted rows (✭) in your model, or:
- the data will be copied over the existing rows.
- Totals row - the query report totals will be placed on this row.
✭ Notes:
The default setting is to Insert rows, enabling you to place additional
content in your model underneath the query. Everything will be shifted down when the data rows
are inserted, and all formula references will be adjusted accordingly. Cell values on columns
adjacent to the query range (i.e. to the left and to the right of the query) will be copied
down.
You can set the cell styles (i.e. font, size, cell format, colors, borders etc.) for each of the 3 template rows. If left blank, default cell styles will be applied.
During Run model, realtime data will be inserted and the above template produces the following result:
Functions
You can use functions to pull selected data from report or data queries into individual cells. Unlike report queries, which insert an entire formatted report into a range of cells in the model, functions enable you to insert a single value or an aggregate total (e.g. a sum or count) into one cell. You can create as many functions as you want, to populate multiple cells with varied data:

The example in this screenshot retrieves the sum of column 4 of query ID 1 for all rows where column 2 = "Revenue"
There is a collection of query functions that you can choose from. All query functions require the same parameters between brackets:
- The 1st parameter is the value or cell reference that you want lookup in the query data.
- The 2nd parameter is the ID of a report or data query. You can define queries within your model, and once defined the ID of a query is shown in the dropdown list in the query preview.
- The 3rd and 4th parameters are optional: By default, all functions assume that column 1 in the query data contains the key value, and that column 2 contains the values that you want to retrieve. You only need to give the column numbers for the values and key as a parameter when different from these defaults.
Cell objects
Cell objects are components that you can insert into a model to create advanced functionality in a model.
To add cell objects, you need to select a cell or range of cells, and click one of these buttons in the toolbar:

You can choose from various types of objects:
- Icons and images - add icons or external images into your model.
- Sparklines and charts - add sparklines (mini-charts) into a cell, or add embedded charts to your model. Sparklines and charts visualize a given cell range in your model. This cell range can be populated by a query, by data entry, or by calculations.
- Links - add navigation links to other objects (e.g. for drilldown into another report or model) or to external documentation.
- Cell editor - create editable cells to make your model interactive (e.g. planning models).
- Row actions - buttons to insert and delete rows (use this to build planning models).
- Comment - add comments to cell, which will popup when the user hovers over the cell.
Once you click the toolbar icon, a popup window will guide you through the process of defining the object.
Planning models
By default, models are read-only in Run model (i.e. all cells will be locked and filters are inactive).
But you can also create planning models that allow users to enter and edit information into the model during Run model. You can create these type of models in 2 or more steps:
- Add cell editors in cells.
- Add row actions in cells (optional).
- Add planners in cells (optional).
- Add Import queries to the model.
Cell editors
Cell editors are definitions that you can insert in a cell (or in a cell range) to make a cell editable (remember: by default, all cells are locked) and define both the type of cell value and the method by which users will be able to enter or select cell values.
To add a cell editor, you need to select a cell or range of cells, click the relevant button in the Insert section of the toolbar, and select the desired editor:

You can choose from 10 types of editors:
- Cell input (text) - allow the user to enter any text.
- Cell input (number) - allow the user to enter numbers only. Formulas starting with = are also allowed, and the numeric result of the formula will be stored.
- Dropdown (list) - shows a dropdown, with the list of values sourced from a cell range or a static (comma-delimited) list of values. By default, the user can only select a value from the defined list, but if the source is a cell range, you can optionally allow the user to enter new values by enabling the option Add new.
- Dropdown (query) - shows a dropdown, with the list of values sourced from a query on the database. By default, the user can only select a value from the query results, but you can optionally allow the user to enter new values by enabling the option Add new.
- Dropdown (planner) - shows a dropdown, with a list of configurable planners.
- Popup (comment) - shows a popup into which the user can enter long text comment.
- Popup (table) - shows a popup table into which the user can enter multiple rows with multiple columns, for example to enter a specification.
- Date picker - shows a dropdown calendar from which the user can select a date.
- Checkbox - shows a checkbox (use this in combination with the Yes/No cell format).
- Color picker - shows a color palette which the user can select from.
When you add a cell editor in a cell or range of cells, those cells are unlocked, and the user can enter or edit data in the model (and validated by the selected editor) during Run model.
Dependent on the type of editor, you may see the following additional options:
- Combo - enable the user to start typing text, which will dynamically filter the list of values. This is only available for "Dropdown (list)" and "Dropdown (query)" editors, and useful when the list contains many values.
- Multiple - enable the user to make multiple selections from the list of values. This is only available for "Dropdown (list)" and "Dropdown (query)" editors. This option can not be used in combination with "Combo" and "Add new".
- Columns - define up to 5 column names, separated by a comma. By default, the popup table shows 2 columns: Description and Value, but you can change these column titles, as well as define up to 3 additional columns, with a date field and 2 text fields. The columns are only shown if you provide a column name. Example: "Description,Value,Date,Number,Comment". This is only available for the "Popup (table)" editor.
- Add new - enable the user to enter a new value, that does not yet exist in the list of values. This is only available for the "Dropdown (list)", "Dropdown (query)", and "Dropdown (planner)" editors.
Editor cell formats
You can choose any cell format you want in cells that contain an editor, but ofcourse there has to be correlation between the type of editor and the type of cell format. For example, a "Cell input (number)" editor can only exist in a cell that is formatted as a number, and the same applies to a "Date picker" editor.
The "Popup (comment)" editor can exist in two different cell format:
- Common: the content is shown as a single line of text;
- Text: the content is shown as multiple lines of text, with line breaks in the right place. You may have to increase the row height to see the full content.
If you select the "Multi" option in "Drowndown (comment)" and "Drowndown (query)", those editors can also exist in two different cell format:
- Common: the selected values are shown as a single line of text, separated by a comma;
- Text: the selected values are each shown on a separate line, and separated by a comma. You may have to increase the row height to see the full content.
The "Popup (table)" editor can also exist in two different cell format:
- Number: the data is shown in the cell as the sum of all values;
- Text: the data is shown as a multi-line list of all descriptions. You may have to increase the row height to see the full content.
Planner editor
Planners are configurable patterns that can be used to distribute amounts across a range of cells (for example, to apply a seasonal revenue pattern to a series of financial periods).
Adding planners to a model requires 2 steps:
- Create one or more Cell editors (Dropdown planner) - you can define multiple planners in each cell editor. A planner consists of a name and a numerical pattern.
- Use one or more PLAN or PLANNER functions in cells, to build any calculations you want.
The below example defines 4 patterns for a cell editor: monthly, quarterly, every half year, and a custom "Summer" pattern:
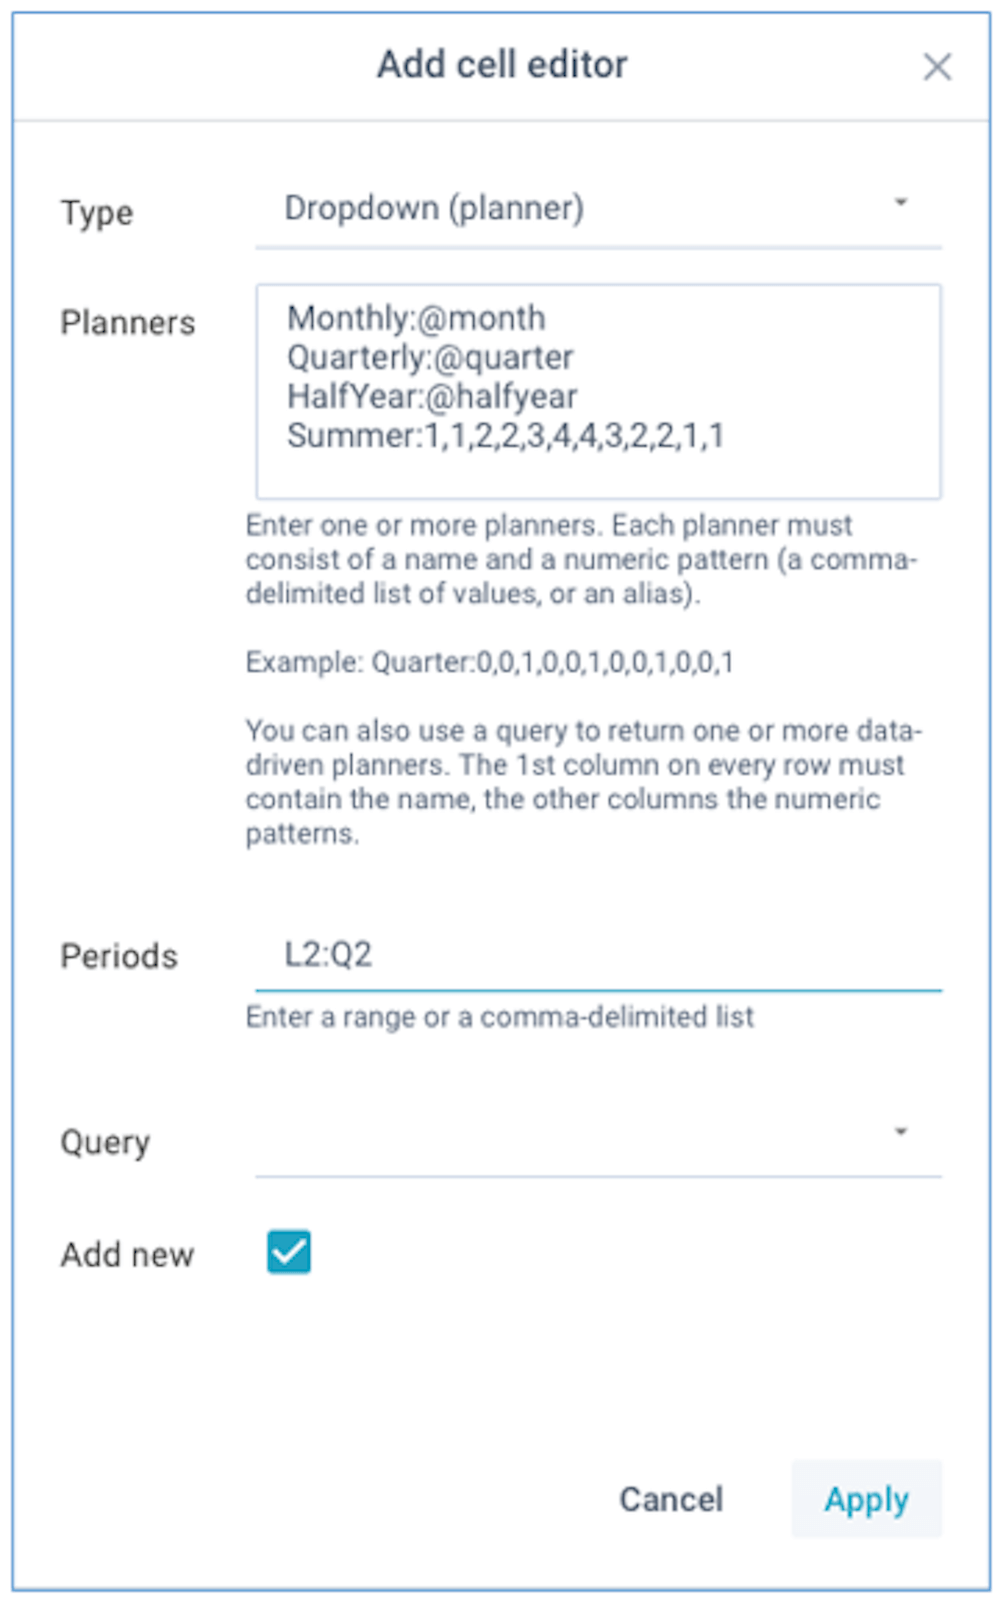
The absolute values of the numeric patterns are irrelevant, what matters is each relative value as a proportion of the sum of all values. You can define as many indices in the patterns as you need.
You can also use one of the below aliases for common patterns:
- @month - every month (1,1,1,1,1,1,1,1,1,1,1,1)
- @quarter - every quarter (0,0,1,0,0,1,0,0,1,0,0,1)
- @soquarter - start of every quarter (1,0,0,1,0,0,1,0,0,1,0,0)
- @halfyear - every half year (0,0,0,0,0,1,0,0,0,0,0,1)
- @sohalfyear - start of every half year (1,0,0,0,0,0,1,0,0,0,0,0)
- @year - every year (0,0,0,0,0,0,0,0,0,0,0,1)
- @soyear - start of every year (1,0,0,0,0,0,0,0,0,0,0,0)
- @period445 - based on 4-4-5 weeks (4,4,5,4,4,5,4,4,5,4,4,5)
In addition to defined static planners, you can also refer to a data query. Your data query can include multiple rows, with each row being treated as a separate planner. The first column on every row needs to contain the planner name, and the other columns need to contain the numeric patterns.
By default, the user can only select one of the predefined patterns, but you can optionally allow the user to manually enter and edit patterns on every row by enabling the option Add new. When selecting the option Edit .. the user can manually enter and edit the pattern:

When you allow editing planners, you can define the names of the periods using a cell range of list a values.
You can use the selected planner using 2 functions: PLAN and PLANNER.
The PLAN function returns the range of absolute values, or the absolute value at the selected index, of the selected planner. You can incorporate those value(s) in any formula.
The PLANNER function returns a proportion of data according to the selected planner and the selected index. The returned value is calculated as follows:
data * value of given planner index / sum of all planner values
If the given index does not exist in the planner, the function will use the given
ratio (which can be a cell reference, a formula, or a given value) and will return
the result of data * ratio.
If neither the index or a ratio exists, the
function will return 0 (zero).
PLANNER(data, planner, index, ratio)
Examples:
PLANNER(1000, "Months", 6) = 83.33 (1000 * 1 / 12
PLANNER(1000, "Weeks445", 6) =
96.15 (1000 * 5 / 52)
PLANNER(1000, "Summmer", 6) = 111.11 (1000 * 4 /
36)
PLANNER(1000, "", 0, B3/C3) = 200.00 (1000 * 1/10, assuming B3=1 and
C3=10)
Popup (table) editor
Using a popup table editor you can enable end users to fill in multiple rows with 2 or more columns, for example to enter specifications.
You can define up to 5 column names, separated by a comma. By default, the popup table shows 2 columns: Description and Value, but you can change these column names, as well as define up to 3 additional columns, with custom column types. The columns are only shown if you provide a column name. Example: "Description,Value,Date,Number,Comment"
The 1st column is a "text", the 2nd column is a "number", and the 3 optional columns are "text" by default, but you can override that by adding ":n" (for numbers), ":d" (for dates), or ":c" (for multi-line comments) to the column name. Example: "Description,Value,Date:d,Number:n,Comment"
The data in popup tables are shown in the cell as the sum of all values if the cell is formatted as a "Number", and as a multi-line list of all descriptions if the cell is formatted as "Text".
The result is stored as text into one single cell on the current row, and can therefore be saved to a data set using an import query, and retrieved into the model again using a query or DGET function. You can use the function UNWRAP to retrieve the sum of all values in the table (just a reference to the cell without further parameters), or all cells in the selected row (with the row number as an additional parameter), as follows:

You can also use UNWRAP to retrieve a formatted in-cell table of all values in the popup table by passing "table" as the additional parameter, as in UNWRAP(A1, "table").
You can also use UNWRAP to retrieve a list of all values in the popup table by passing the column id as an additional parameter, as follows:
- t = Text (description)
- v = Value
- d = Date (optional column)
- n = Number (optional column)
- c = Comment (optional column)
You can use the returned list of values in any other function or calculation. Some examples:
UNWRAP(A1, "t")
SUM(UNWRAP(A1, "v"))
FIRSTDATE(UNWRAP(A1, "d"))
JOIN(UNWRAP(A1,
"t", "; ")
JOIN(UNWRAP(A1, "t", "\n")
If you set a model to be view-only, or if you apply a LOCKROW or LOCKCOLUMN, the editor will not open and it may be difficult for users to see its full contents. Therefore, you can also set this editor to be "view-only", so it will allow the user to open the editor and see all table details, but without being able to edit.
Images
You can incorporate images in models, based on an external URL. The cell data can be dynamic, enabling you to show images based on your data (e.g. product images or document scans).
Images are "anchored" independently over the cells in the sheet. You can drag (and resize) them how you want, even in front of visible cells. They maintain their position even if you insert or delete rows and columns, except when inserting or deleting rows in Run models through report queries, DROWS, DCOLUMNS, TRANSPOSE functions, or Row actions.
In Run model, sheets will always have the exact number of rows and columns that contain data, without any trailing empty rows or columns. When using report queries, extra rows or columns may be inserted and images will be re-positioned accordingly, but images can never exceed the position of the last row or furthest column with cell data. Therefore, you may have to create some cell value (for example, behind the right-bottom corner of the image itself) to allow it to be properly re-positioned.
Charts
You can incorporate charts in models, based on cell data in your model. The cell data can be populated through queries, enabling you to build highly interactive dashboards. You can control the appearance of charts via a number of settings across 3 sections: Common, Series, Extras.

Charts are "anchored" independently over the cells in the sheet. You can drag (and resize) them how you want, even in front of visible cells. They maintain their position even if you insert or delete rows and columns, except when inserting or deleting rows in Run models through report queries, DROWS, DCOLUMNS, TRANSPOSE functions, or Row actions.
In Run model, sheets will always have the exact number of rows and columns that contain data, without any trailing empty rows or columns. When using report queries, extra rows or columns may be inserted and charts will be re-positioned accordingly, but charts can never exceed the position of the last row or furthest column with cell data. Therefore, you may have to create some cell value (for example, behind the right-bottom corner of the chart itself) to allow it to be properly re-positioned.
Tables
You can incorporate tables in models, showing the results of a selected query.
Tables are "anchored" independently over the cells in the sheet. You can drag (and resize) them how you want, even in front of visible cells. They maintain their position even if you insert or delete rows and columns, except when inserting or deleting rows in Run models through report queries, DROWS, DCOLUMNS, TRANSPOSE functions, or Row actions.
Tables are meant to display small sets of data. They intentionally do not support scrolling as that would not work when printing the model or exporting it to PDF. Please ensure your query returns a small number of rows and the table window is sized accordingly.
In Run model, sheets will always have the exact number of rows and columns that contain data, without any trailing empty rows or columns. When using report queries, extra rows or columns may be inserted and tables will be re-positioned accordingly, but tables can never exceed the position of the last row or furthest column with cell data. Therefore, you may have to create some cell value (for example, behind the right-bottom corner of the table itself) to allow it to be properly re-positioned.
Row actions
Row actions are are configurable buttons that you can insert in a cell in a model to allow rows to be inserted, copied, or deleted.
To add row actions, you need to select a cell or range of cells, click the relevant button in the Insert section of the toolbar, and select the desired action:

This option enables you to define precisely where rows can be inserted, copied, or deleted in the model during Run model. Typically you would only enable this in the data entry section of your model.
Once created, you can call the row actions by clicking on one of the icons. Row actions are only active in Run models.
Import queries
By creating an import query in your model, you can save information back into a data set.
For every import query, you can select how new data will be imported into the data set:
- Add to - add new data to the existing content of the data set.
- Overwrite - overwrite the entire existing content of the data set.
- Replace in - selectively replace existing content of the data set. For example, anytime you import a certain financial period, you might want to overwrite the previous content for that same period. If you select this option, you also need to indicate which column(s) will trigger the replacement. Read more here.
- Update in - update the given columns in existing rows in the data set, based on the value of the Key column. This option will only update fields with a new value in existing rows in the data set, preserve all other existing data. It ignores data in the import source that does not exist in the data set. The target data set must have a defined Key column, because that is used to determine whether a given row already exists or not.
- Insert in - insert rows that do not yet exist in the data set, based on the value of the Key column. It ignores data in the import source that does not exist in the data set. The target data set must have a defined Key column, because that is used to determine whether a given row already exists or not.
- Upsert in - update the given columns in existing rows in the data set (similar to "Update in") and insert rows that do not yet exist in the data set, based on the value of the Key column. The target data set must have a defined Key column, because that is used to determine whether a given row already exists or not. Upsert is effectively the same as Update + Insert.
- Delete from - selectively delete existing content from the data set. Data that matches your data source will be deleted. No new data will be imported. If you select this option, you also need to indicate which column(s) will trigger the deletion. Read more here.
Once you have added an import query to a model, a Save button will automatically be added to the Run models screen, and the user can enter and edit data (in cells where you have created the above cell editors) and click the Save button when done.
XLReporting expects the row below your query to contain columns headers, and you can specify how many rows of data you want to import. If you combine import queries with report queries, the number of rows will be automatically expanded based on the results of the report query.
For each column in your target data set, you can either select the relevant column in your model, a static value, or a function. You can also transpose columns into rows, convert the data, and filter the data. It works in the same way as Define imports.
When saving, XLReporting will try to process every row it encounters, up until the number of rows you have specified.
The option Keep silent suppresses non-critical notifications during the save process. Only real errors will be shown. Regardless of this setting, all results will always be shown in Actions - View saved results when running the model.
When defining models, you may often lay out information across columns, for example period-by-period amounts. The option Transpose data will transpose the selected column data into rows and you can use the 2 special columns TRANSPOSE in the column mapping to your data set. By default, the transpose operation will skip empty values and zeros. If you want to transpose all columns onto all rows even if they are empty, you can do so by selecting the Also include empty option.
The option When empty enables you to define the action when a field has no source value: either skip the entire row, abort the entire import (nothing will be imported), or repeat the value from the previous row (which is useful if your import data is grouped).

✭ Notes:
Import queries take their source data from the tabular column and row data in the defined range
in the model. If you want to refer to other cells in the model outside that source range (for
example, to include in calculations or convert expressions) you can do so with the CELLVALUE
function. You'll need to specify the required cell as a text, you can not use other functions
with cell references or cell ranges. Import queries have no positional awareness of cells within
the model.
Define import batch
Click on the Import batch field to combine multiple imports into a batch which are then run as one single action together with the import queries of this model.

You can insert or delete imports at any time, and re-order them, using the dropdown menu in the last column.
By default, imports will be started in the order that you define them, and processed in parallel (i.e. near simultaneously). This gives the fastest performance in general, but if you have certain imports that require other imports to be completed first, you can set Wait in line. When this option is set for an import, it will only be started and processed once all its predecessor imports have completed.
Actions
When defining a model, you can use the Save and Actions buttons in the right-top of the screen:

These buttons enable you to do the following:
- Save - save your changes (or Ctrl+S)
- Actions - open a dropdown menu with further options:
- Create new model (or copy one)
- Delete this model
- Import from Excel
- Import from object
- Preview and test
- Export data or print
- Review this model
- Mark this version
- Add to dashboard
- Run this model
Please note that the list of actions is dependent on the permissions (in your user roles) that you have been given.
Import from Excel or object
You can import an existing worksheet from an Excel spreadsheet to convert it into a model.
If you have the relevant permissions, you can also import individual queries or sheets from another model in an configuration export file from Transfer Objects. This function requires the same data sets in this tenant as in the configuration file you are importing. You should check your import carefully. If in doubt, you can always (re)import the entire model via Transfer Objects.
Print and PDF export
Using the PRINT function anywhere in your model, you can dynamically define page numbering, pagination, repeating headers, and paragraphs (widow/orphan control). You can also dynamically hide sheets, rows, columns, and cells when printing or exporting to PDF. This only takes effect in prints and PDF exports, on the screen you will see icons as placeholders.
XLReporting will always try to fit the content to the available page width, as following:
- If the content is wider than the page width, all column widths will be reduced proportionally.
- If the content is smaller than the page width, all column widths will be expanded proportionally as long as the difference (the remaining white space) is no more than 30% of the page width. Expanding column widths beyond 30% would stretch the content out of proportion, and possibly affect the height/width ratio of embedded charts, images, and tables. Therefore, in such case the content will not be fit to the page width, and white space will remain at the right margin of the page.
- By default, the width of all visible columns is proportionally adjusted to fit the page width. However, you can overrule that by setting PRINT("adjust") in one column to instruct XLReporting to adjust only the width of that single column. The width of all other columns will remain unchanged, as well as the height/width ratio of embedded charts, images, and tables.
Page numbering is automatic, starting at 1 and numbering sequentially through all pages and sheets in the model. Hidden sheets are excluded from page numbering. You can also specify a specific page number by setting PRINT("number", start) at any place in your model where start is the new page number. The page numbering will continue to increment from that number onwards.
Review this model
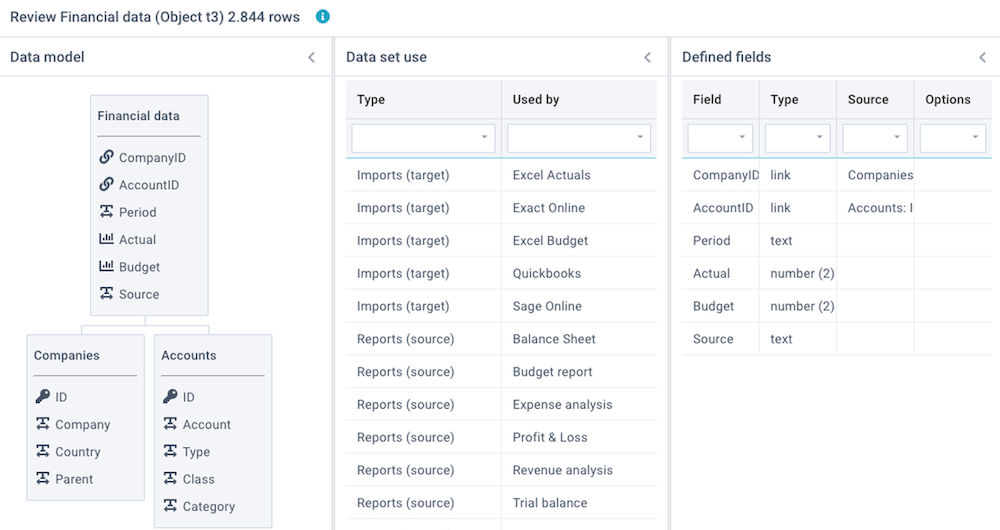
Click on Actions - Review this model to review a number of aspects of this model and its currently selected query:
- Data model - shows a diagram with all linked data sets. This is derived from columns that are set to data type Linked values.
- Linked objects - shows all linked imports, reports, and models that are using this data set, and the total number of data rows in this data set.
- Linked data - shows the results of checks on the Key values and Linked values that are used to link data sets. Because linked values need to correspond with key values, this integrity check is important.
- Defined fields - shows a summary of all defined columns and data types.
- Recent activity - show all recent user activity relating to this data set.
You can also watch the tutorial video.
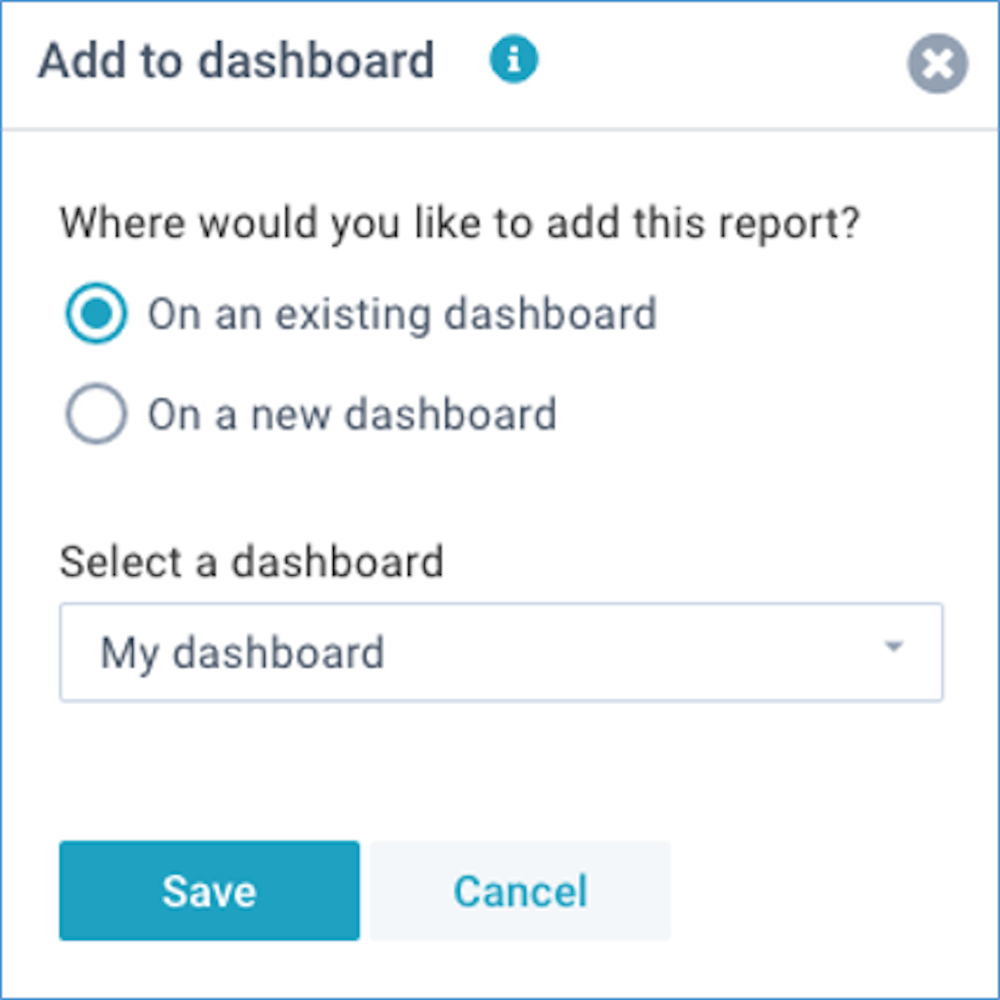
Add to dashboard
A dashboard is a personal page with your own favorite reports and models. You can create multiple dashboards, and each dashboard can contain multiple reports or models.
Click on Actions - Add to dashboard to add this model to either a new dashboard, or to a new dashboard (watch the tutorial video):